About
Hi There.
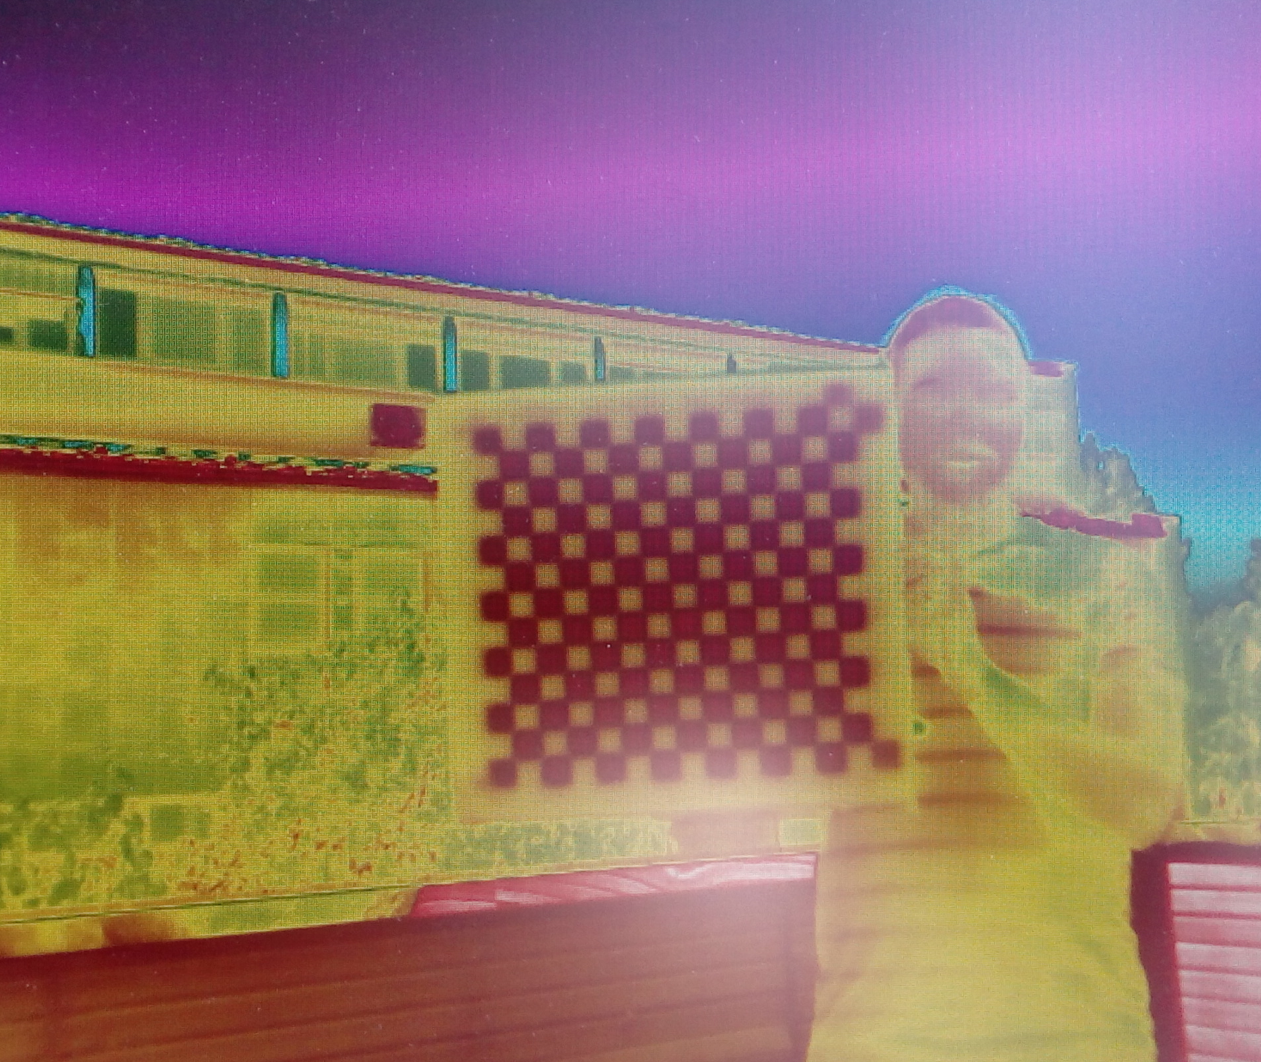
My name is Florian Ellsäßer. In the last years, I have worked with thermal maps and images on a daily basis. I mainly gathered my data with radiometric thermal cameras attached to UAVs/drones, but also used satellite images and hand-held thermal cameras. To make use of this great treasure of thermal data, I have created this toolbox full of free and open-source QGIS3 plugins to help you and others with their research projects.
I am passionate about creating simple and easy-to-use tools to facilitate the use of rather complex workflows and analysis processes. EcoThermographyLab is the place where I want to share my workflows, to enable everybody to use thermal data in an agricultural, environmental and ecological field of research.

The Ecothermography Toolbox
Having worked with thermal maps and images during my master studies and PhD for over six years now, I gathered many useful tools. Modelling evapotranspiration, ecosystem respiration and many more processes based on land and canopy surface temperatures, I realized that there were no free, open-source and easy to use tools, that would also allow beginners and more seasoned scientists to perform these interesting analyses. Therefore, I just created these tools and accompanied them with tutorials to show how to use them, and made everything available through EcoThermographyLab.
To run a simple energy-balance model and calculate the energy and mass fluxes such as evapotranspiration (latent heat flux) from thermal images, you can use QWaterModel. If you are more interested in stress indices, you should try the CWSI tool. This tool helps to calculate the crop water stress index (CWSI) from thermal images and maps, using three different approaches, depending on your data availability. With the experimental Ecosystem Respiration Tool plant respiration estimation from land and canopy surface temperatures become really easy. If you are more interested in the patchiness and diversity of landscapes from thermal maps, you can try the ThermalMetrics tool. This tool calculates the Shannon Diversity Index, the Simpson Diversity Index and many others indices based on your thermal images. It also creates several other metrics and provides useful basic information on your thermal maps.
This toolbox is of course far from complete yet, and since I’m always curious to build new things, I will add new tools from time to time. Maybe you are also looking for a new tool to work with your thermal images and maps? Or you have that great idea for a new and challenging workflow? Share your ideas with me and maybe we can develop a new tool together.

