There are a few tutorials around that help you calculate the crop water stress index (CWSI) from thermal images. The CWSI is not a very complex index and the calculation can also be done in e.g. the QGIS raster calculator. But why make things complicated if you can just download a plugin and do the calculation streamlined with a nice graphical user interface? This tutorial will exactly show you this simplest way to calculate the CWSI from land surface temperatures in QGIS3.
You will learn:
- how the CWSI works and how it can be interpreted
- how to install the free open-source software CWSI plugin
- how to calculate CWSI from thermal images of land surface temperatures
- how to improve your results
Let’s start with some background. You can skip this section if you are looking for fast results. I also might have simplified some of the rather complex relationships here to keep it short and understandable.
What is the CWSI and how is it connected to land surface temperatures?
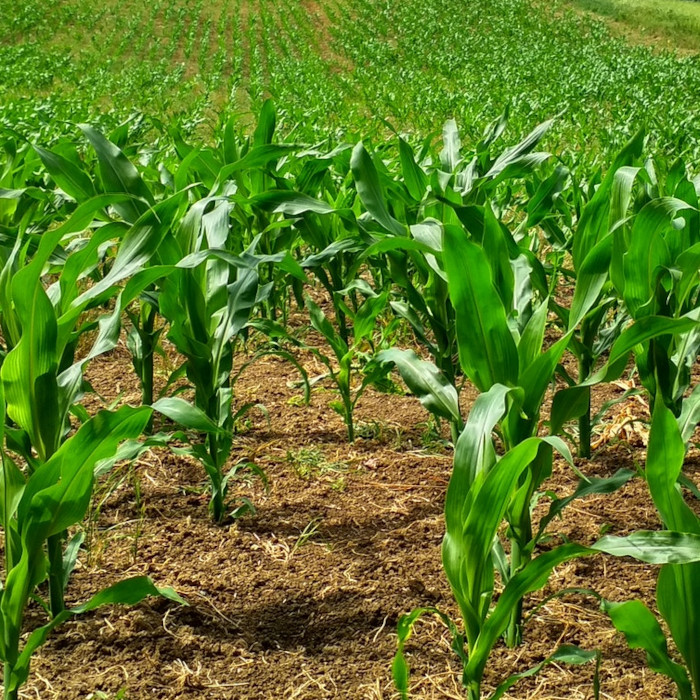
Plants transpire to transport water and nutrients to the leaves to support the photosynthesis process. This process of transpiration cools the plant surface in a process called evaporative cooling. If a plant is under water stress, because there is not enough water available to transpire, the transpiration remains below the potential maximum and the surface temperature of these plants is warmer than it could be under ideal conditions. The crop water stress index uses the possible minimum temperature of a wet surface (Twet) and the possible maximum temperature of a dry surface (Tdry) to relate the actual plant temperatures in the area. If the plant surface temperatures are very close to Twet, it is assumed that they have enough water available for transpiration and that they are not stressed. If the plant surface temperatures are closer to the reference dry surface Tdry, it is assumed that the plants are water stressed. The CWSI is therefore a very simple but very useful index for plant water stress derivation from thermal images of land surface temperatures.
How to calculate the CWSI from thermal images?
To efficiently calculate the CWSI, we first need to install the necessary software.
We are going to work with the free QGIS3 software. You can download it here. From my experience, I can recommend to use the “full OSGeo4W Network Installer”, because it installs many very useful dependencies too.
Any QGIS3 version should work, QGIS2 versions will NOT work. Follow the steps in the installation guide and open the QGIS3 canvas.
Install the CWSI plugin
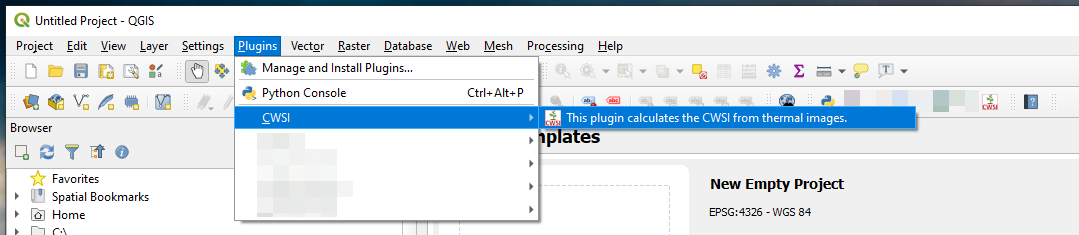
With QGIS3 installed, and opened, go to the tab Plugins and then to “Manage and Install Plugins…”:

Click on “Manage and Install Plugins…” and open the plugin manager.
In the plugin manager click on “All”, then type “CWSI” into the search box. The CWSI Plugin should then be ready to install.
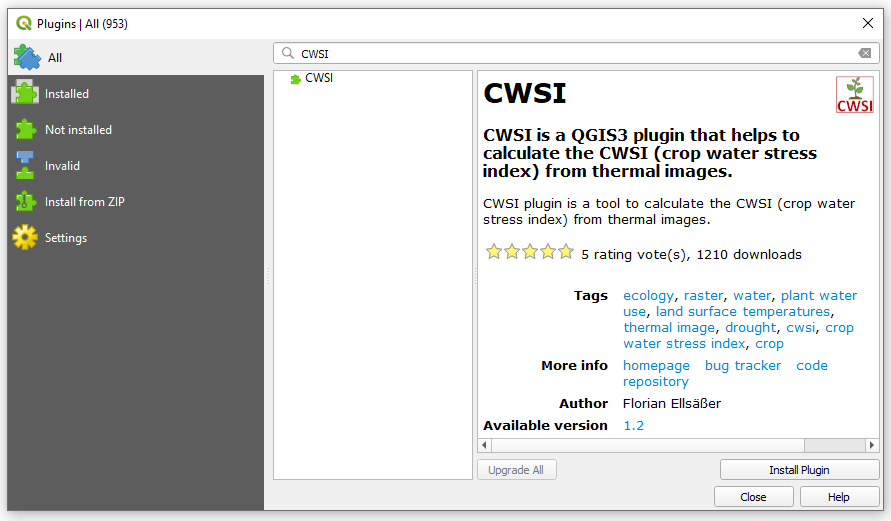
To install the CWSI plugin click on “Install Plugin”. The Plugin should then be installed and be ready to use. You can close the plugin manager now. In this tutorial we work with version 1.2 but later versions should work very similar.
Calculating the CWSI with the CWSI plugin
To open the CWSI plugin, you can either select the tab Plugins and then navigate in the drop down menu to CWSI or you can quickly click on the CWSI icon among your installed plugins.
The CWSI GUI will now open.
The minimal approach to run the CWSI calculation:
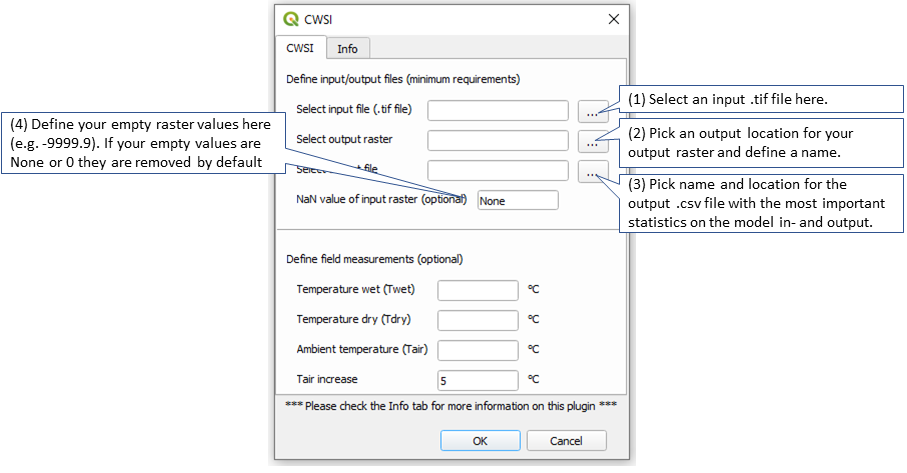
To run the CWSI plugin you’ll need an image or a map with land surface temperatures e.g. of a field with crops. This image can be recorded by satellite, plane, drone or by a handheld thermal camera. You can either use your own georeferenced, single-band raster, where each pixel represents a temperature measurement either in Kelvin or degree Celsius, or you can download an example picture here.
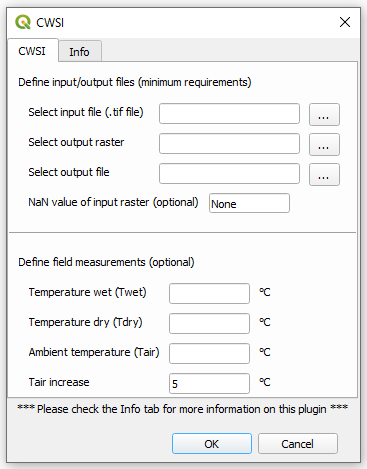
(1) To load the thermal image, please use “Select input raster” to search and define your input image on your computer. If this step was successful, you should now see your map on the canvas.
(2 and 3) Define the path for the output raster and the output file that contains the output information too.
(4) If your thermal image contains empty values, you can define them in this step. This is an optional step. You don’t need to specify anything if there are no empty values in your image or if these empty values are either 0 or None.
Now click OK and run the CWSI calculation. After a few seconds, a new layer will appear on top of the thermal image. This new raster layer is the result layer. It contains one-band with the model results.
Your raster is saved as a .tif file and the statistics are saved in a .csv file in the location that you specified in step (2 and 3).
If you wonder how exactly the CWSI was calculated, you can check this reference: The CWSI calculation is based on equation 9.6 from: Jones, H. G., 1992. Plants and microclimate, 2nd ed.: Cambridge University Press, Cambridge, UK.
How to interpret the results of the CWSI calculation?
Now you have your first CWSI estimate. An extreme CWSI of 1 (one) indicates that the plants are very water stressed, while an extremely low CWSI of 0 (zero) indicates no water stress at all. Usually most of your results will be somewhere in between. But since our first CWSI calculation is based on only very little data input (just the thermal images), there is lots of room for improvement. In the following step, you’ll see how you can improve your CWSI estimates using field measurements.
How to improve your CWSI results?
In this step, we will significantly improve the accuracy of your CWSI estimates. The idea of this section is very simple: the more data you provide to the CWSI plugin, the closer your estimates are to the real world.
(5) The classic measurements to calculate an accurate CWSI estimate are Twet and Tdry. These are the temperatures of a very wet and a very dry surface, measured in the ecosystem of interest. Usually these temperatures are measured with so-called wet- and dry bulbs. To achieve really accurate results, I recommend to perform these measurements along with the recording of the land surface temperatures if possible.
(6 and 7) However, it might be difficult to get the Twet and Tdry measurements in the field. But fear not, there is a simple workaround. Alternatively, you can use measurements of ambient air temperature Tair and use a defined Tair increase (that is a 5° increase by default here). If you want to read more about this procedure you can check this paper:
Irmak, S. Haman, D. Z., Bastug, R. 2000. Determination of crop water stress index for irrigation timing and yield estimation of corn. Agronomy Journal 92
Finally click the “OK” button to run the CWSI plugin. Your raster is saved as a .tif file and the statistics are saved in a .csv file in the location that you specified in step (2 and 3).
Did you encounter problems? Or did you find a bug?
I am always happy to help and I am even happier to remove bugs from the software. Just write me an email via the contact form.
How to cite the CWSI plugin?
If you are using this plugin for a scientific publication please don’t forget to cite it accordingly using:
Ellsäßer, F. (2021) QGIS3 CWSI Plugin version 1.2 URL: https://plugins.qgis.org/plugins/cwsi/
Please also cite the publications that helped to create this plugin:
Jones, H. G., 1992. Plants and microclimate, 2nd ed.: Cambridge University Press, Cambridge, UK.
Irmak, S. Haman, D. Z., Bastug, R. 2000. Determination of crop water stress index for irrigation timing and yield estimation of corn. Agronomy Journal 92
More Information
The CWSI plugin is the result of some rainy evenings during my PhD studies in 2020. I realized that there was no simple tool for CWSI estimation out there, that was simple to use, easy to access and open-source. I don’t claim that it is perfect yet and due to its simplicity, I cannot guarantee that it will work under all conditions. If you have any suggestions, ideas for improvement or further development, did you find a bug or do you want to contribute to the CWSI project, please feel free to contact me via the contact form.
You can find the CWSI repository here.