EcoThermographyLab
The place for open-source thermography tutorials and software in QGIS3
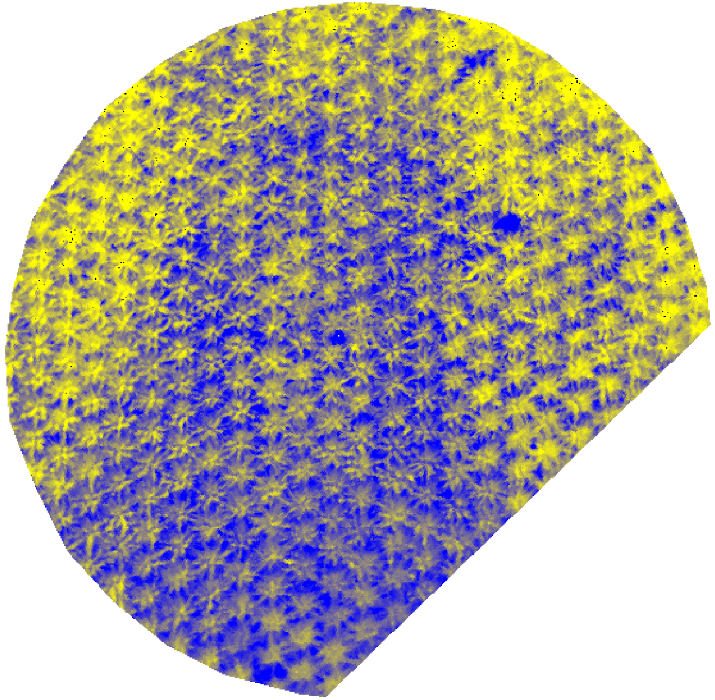
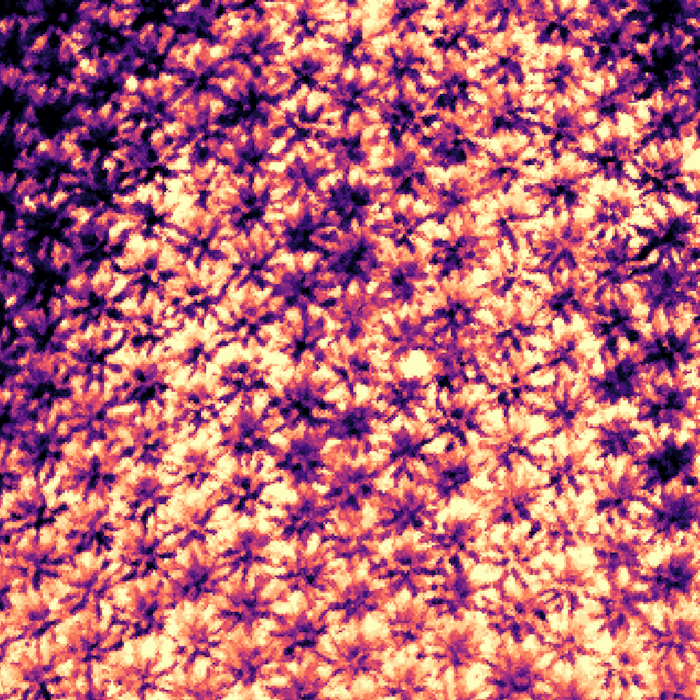
Do you plan to work with thermal images or maps in an environmental, agricultural or ecological context? Then EcoThermographyLab is the right place for you. It is an ever-growing collection of free and open-source software that can help you for your analyses, research and teaching. It provides many tutorials based on QGIS3 to help you get started analyzing your land surface temperature data in no time.
Since this collection is always evolving, it doesn’t only include already well-tested software that has seen significant improvement through user input over time, but also very new experimental software. Use the contact form if you see some improvement potential or if you feel that a tool is still missing here. Let’s develop this ecothermography toolbox together!
Tutorials
Energy-Balance and Evapotranspiration
This tutorial will give you an easy introduction into the calculation of evapotranspiration from thermal images of land surface temperatures.
Crop Water Stress Index (CWSI)
In this tutorial you will learn how to apply the crop water stress index - CWSI and how to calculate it from thermal images from land surface temperatures.
Ecosystem and Plant Respiration
This tutorial shows you how to estimate ecosystem and plant respiration from images or maps of land surface temperatures .
Thermal Metrics
When working with thermal images, the first step is to get all the important metrics from the images and extract the patches and patch indices from the image or map.
Free and Open-Source Software

It is available for download here.
This QGIS-plugin is a great and easy to use tool to calculate the crop water stress index from thermal images.
It is available for download here.

Estimate ecosystem and plant respiration with this simple to use QGIS3 Plugin.
It is available for download here.

Get all the metrics of your thermal map or image and calculate patches and indices with this QGIS3 plugin.
It is available for download here.
What is Missing?
What is missing in this toolbox? What can be improved with the existing tools? Which tool would you need for your research? Which tool would you need to better explain a complex modelling issue to your students?


